Detection of Trees in South Africa
Using Deep Learning
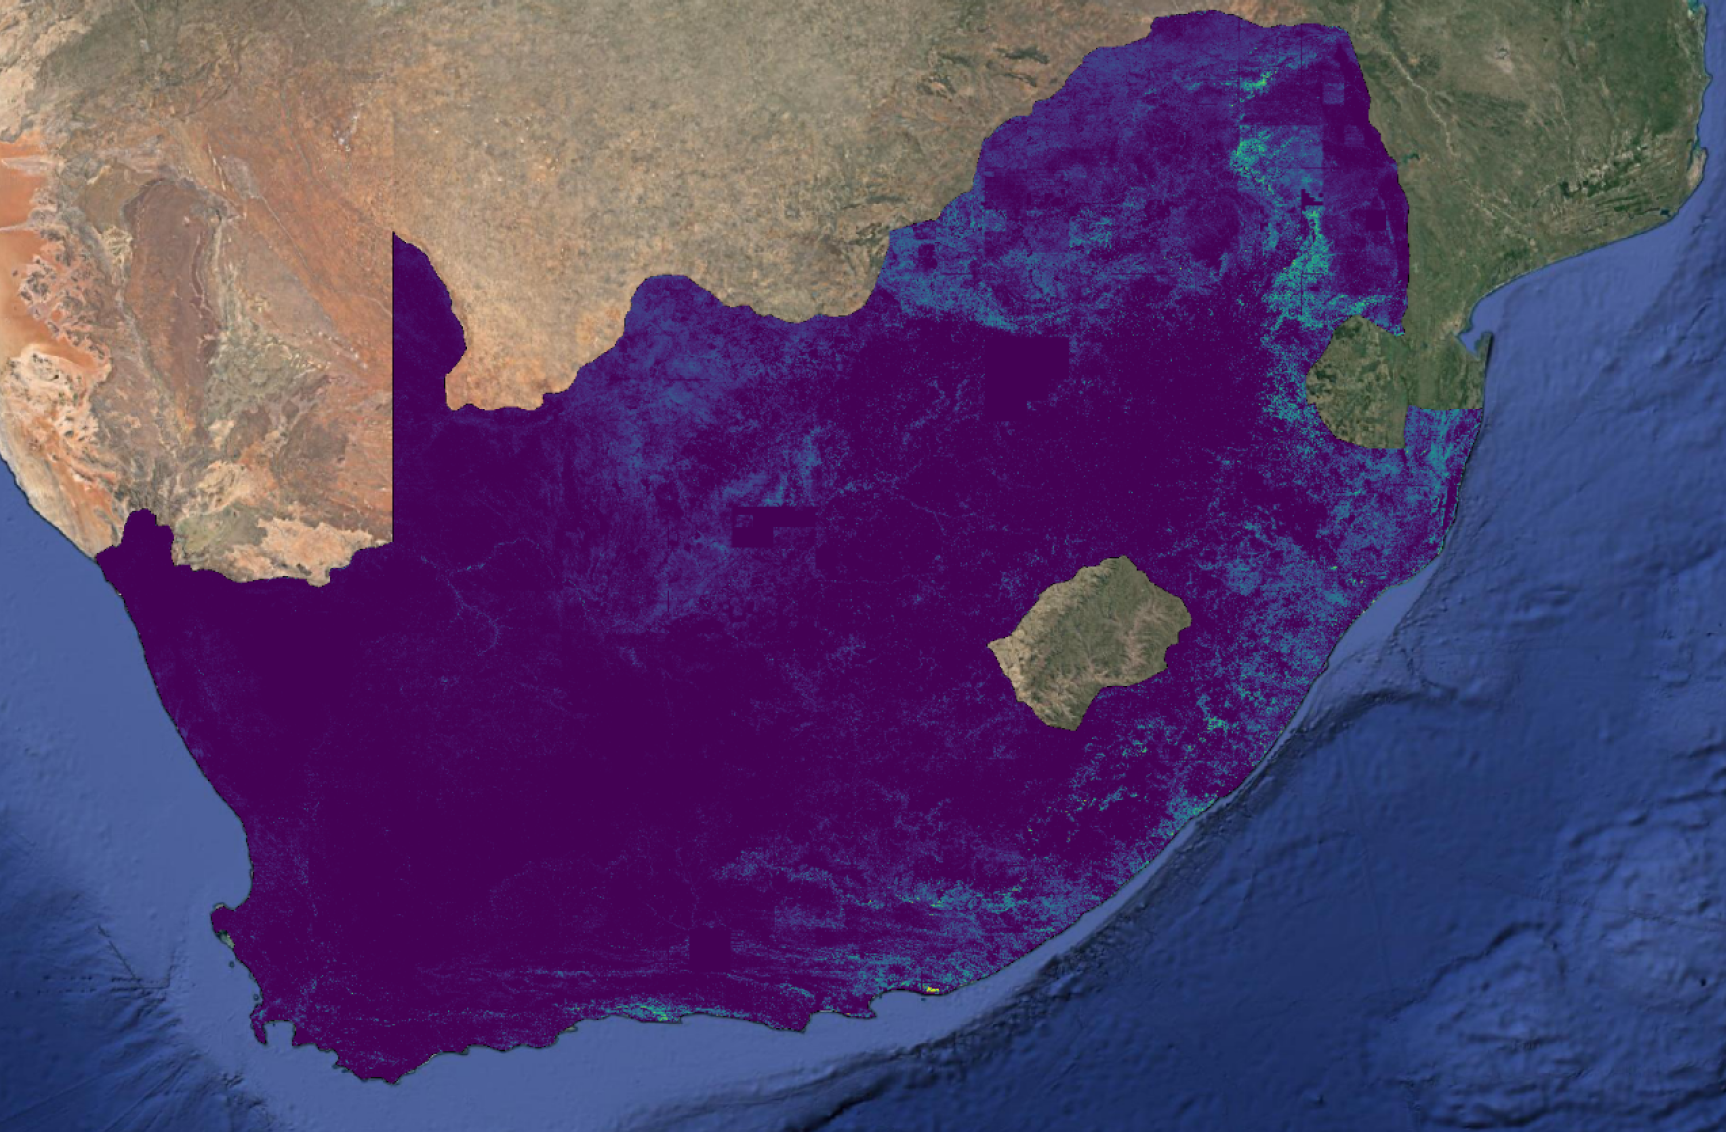
Climate change and anthropogenic pressure have been known to drive some ecosystems towards tipping points where their structure and functioning could be suddenly or irreversibly altered. However, the lack of large-scale unit-level data has constrained the accurate quantification and monitoring of the status and pace of the change within and across all landscape types. Here, we used very high-resolution images covering the whole of South Africa and deep learning methods to map around 4,159,227,100 of single trees and shrubs across all ecosystem types in South Africa. The integration of our results with existing dataset on ecological regions and biomes reveals a portion of trees (+151.15% larger tree coverage compared to previous maps) in shrublands, shrubs in grasslands, and trees in some areas considered forests, which is significantly different from the guiding thresholds in the existing definitions of these ecosystems, suggesting a potential shift in their structure and functioning. More specifically, our results allow a nation-wide localisation and quantification of the following ecological phenomena in South Africa: forest transition (which can include savanisation, where areas defined as forest transition into savanna), bush encroachment, woody plant encroachment, bush invasion, shrub encroachment, and woody encroachment. Although some of these phenomena can be observed as beneficial given an ongoing fight against drivers of climate change and biodiversity loss such as deforestation, our results can benefit the policy formulation towards location-specific management of the ecosystems to optimise their potentials for mitigating both climate change and biodiversity loss in South Africa.
Approach
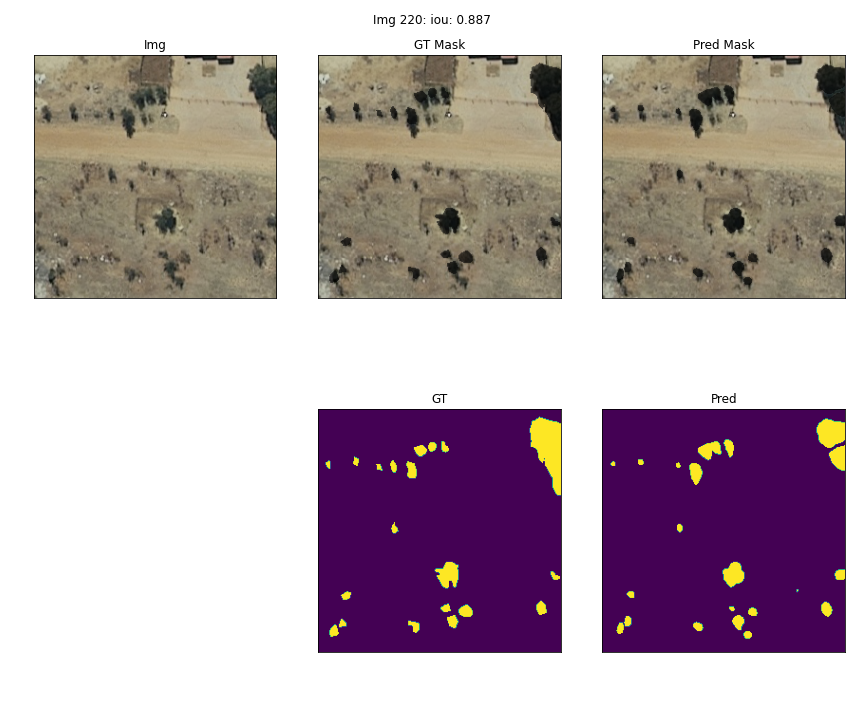
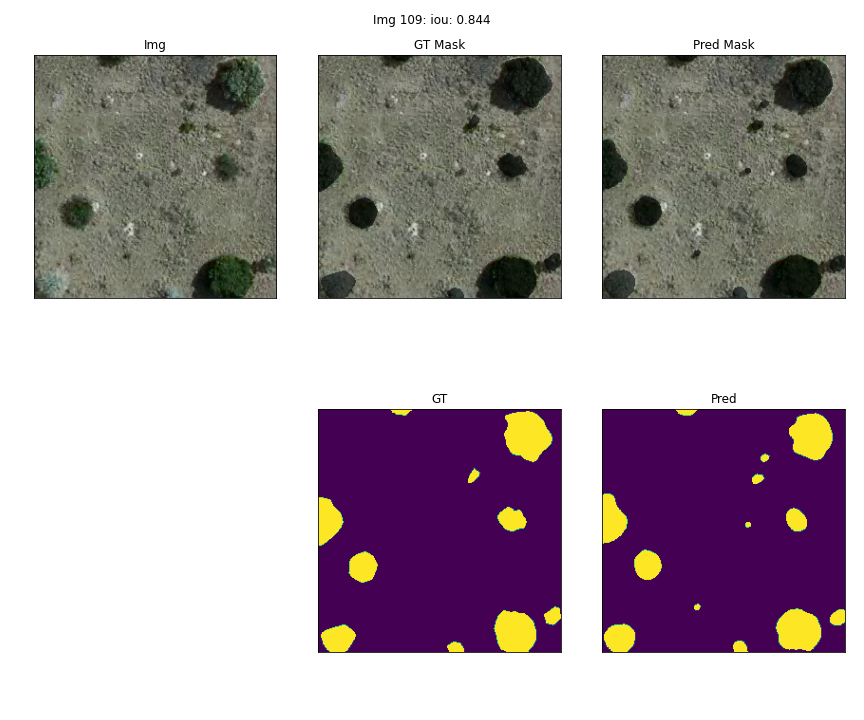
The primary task of this study was to create a national-scale map of individual trees and shrubs in South Africa using high-resolution data. Previous attempts at tree mapping in the region have relied on low-resolution data sources, such as PlanetScope maps with a maximum resolution of 3m. These low-resolution maps likely overlook smaller trees and particularly shrubs. The motivation for our high-resolution map is to identify and quantify shrub encroachment, a major issue in South Africa where the rapid proliferation of shrubs reduces the available area for tree growth. High-resolution satellite imagery from 2009 to 2020 was used for this study. Imagery from 2009 to 2016 had a resolution of 40 cm per pixel, while imagery from 2017 to 2020 had a resolution of 20 cm per pixel. A deep learning model, specifically a SegFormer model, was trained to segment individual tree canopies. The model was initially trained on labeled data from Rwanda and later enriched with manually labeled regions from South Africa. The Rwandan data included 100,000 labeled trees from 2008 at a 20 cm resolution and 50,000 labeled trees from 2019 at an upscaled 20 cm resolution. An additional 40,000 trees from South Africa were manually labeled, with resolutions varying between 20 and 40 cm for regions that were not covered by the Rwandan dataset. To make the model more resilient against varying resolution and color intensities, extensive data augmentation techniques were employed. The mean Intersection over Union (mIoU) was used as the metric for validation.


The trained model was then applied on the entire dataset to create a tree cover map for the entire country of South Africa.

The code for this project is stored in the following Github repository.